
RSI as the speedometer of a stock
When you’re driving and want to take a U-turn or stop for a rest, you don’t just slam the brakes — you first slow down. The same thing happens with stocks. Before a stock changes direction or takes a “rest” in its price movement, its speed (momentum) slows down.
That’s exactly what the Relative Strength Index (RSI) tells us — it measures the speed and strength of a stock’s price movement. By reading this “speedometer,” traders can get clues about when a stock might be ready to reverse, pause, or continue its journey.
Using RSI the old way
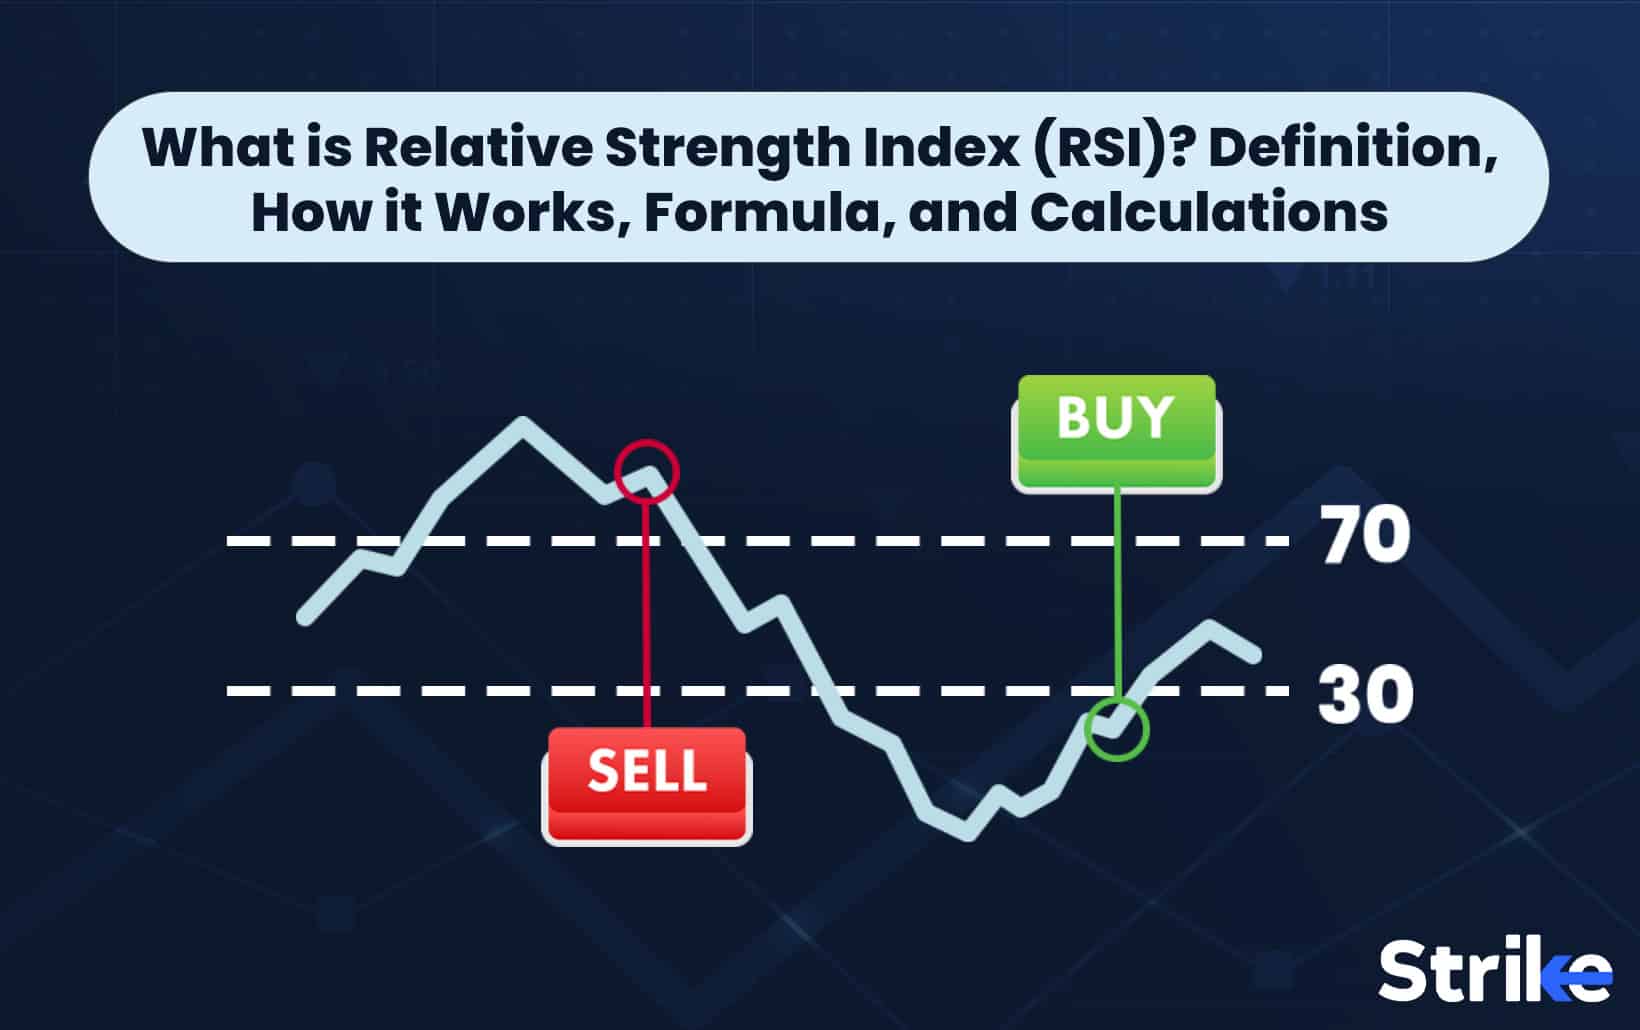
Many traders believe that when RSI goes above 70, the stock is overbought and ready to fall, and when it drops below 30, it’s oversold and ready to rise. But this old 70/30 rule often doesn’t work well, especially on monthly charts. For example, stocks like Tesla (TSLA) and Amazon (AMZN) have crossed above 70 RSI on their monthly charts but kept moving higher for months and even years, riding strong momentum. This shows that RSI alone can’t tell the whole story. If you rely only on the 70/30 levels, you might sell winners too early or buy too soon, missing out on big trends and profits.

RSI 2.0 THE60/40 RULE
The old 70/30 RSI levels are like looking at the stock market in black and white. It’s time to switch to HD mode with the 60/40 rule.
Here’s how it works:
- RSI above 60 → The stock is considered strong and likely in an uptrend.
- RSI below 40 → The stock is considered weak and likely in a downtrend.
- RSI between 40 and 60 → The stock is moving sideways, and it’s better to wait for a breakout.
This approach helps traders stay with the trend instead of getting shaken out too early. For example, Infosys and HDFC Bank have stayed above 60 RSI for long periods on their weekly and monthly charts while delivering consistent gains. On the flip side, stocks stuck below 40 RSI, like many falling midcaps in 2018, kept sliding lower no matter how “cheap” they looked.
By using the 60/40 rule, you focus on trading strength and avoiding weakness — exactly how big players do it.RSI 60 as a Support
One of the most powerful secrets in RSI 2.0 is using RSI 60 as a support zone in strong stocks. When a stock is in a healthy uptrend, its RSI often pulls back to around 60 and then bounces — just like price bouncing from a support level on the chart.
Think of it like this: in an uptrend, the market “takes a breath” but doesn’t lose its strength. If RSI stays above 60 and turns upward again, it’s a sign that buyers are still in control and the rally may continue.
For example, Tata Consultancy Services (TCS) and Reliance Industries have shown multiple instances where RSI dipped to around 60 during a pullback and then the stock resumed its upward journey, rewarding patient traders.
By watching RSI 60 as a support, you can time your entries during pullbacks instead of chasing prices at the top.
RSI in Different Timeframes — The Family Connection
RSI works best when you look at it across multiple timeframes. Think of it like a family:
- Monthly RSI = Grandfather
- Weekly RSI = Father
- Daily RSI = Son
In a family, if the grandfather and father are strong and healthy, they can guide the son and pull him back on track if he starts going astray. The same thing happens in trading with RSI.
If both the monthly and weekly RSI are strong (say, above 60), then whenever the daily RSI dips to 60 or even 40, it often takes support and bounces back — just like the “son” being pulled back into the strong zone by the elders.
This multi-timeframe approach helps traders avoid false signals and stay aligned with the bigger trend. For example, if monthly and weekly RSI for Infosys are both above 60, a dip in the daily RSI to 40–60 can be an excellent buying opportunity in line with the dominant uptrend.